Here’s something worth knowing upfront, since it trips a fair number of people up: TradingView’s advanced charting tools are no longer accessible from within the Deriv dashboard itself. There’s no button, menu item, or Trader’s Hub card that takes you there anymore. Deriv’s own materials confirm the advanced charting experience now lives at a standalone address, charts.deriv.com, and getting to it means manually typing that URL into your browser rather than navigating there through Trader’s Hub. What the dashboard does still offer, and what this article spends most of its time on, is the newer trade-from-TradingView integration, which works differently and is accessed a different way entirely.
To go through these steps smoothly make sure you have created a Deriv account if you do not have one already.
Reaching Advanced Charting: A Manual Step, Not a Dashboard Link
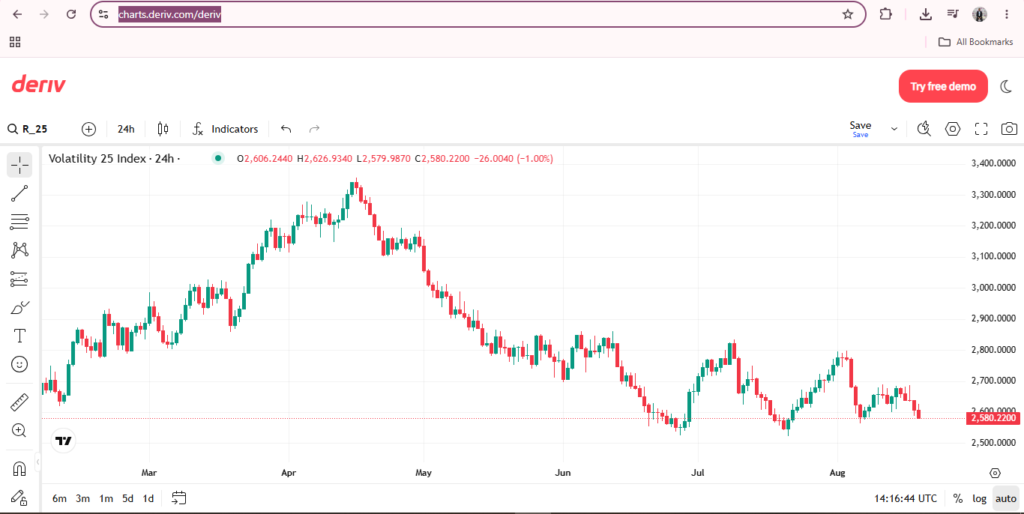
To be direct about this, since it’s easy to assume otherwise: open a new browser tab and type charts.deriv.com/deriv yourself. This isn’t linked from your profile menu, or any visible dashboard element as of the current setup. Once there, log in using your existing Deriv credentials, and you’ll land on Deriv’s TradingView-powered charting environment, separate from the main Deriv platform you’re used to.
What’s Actually on the Dashboard: Trade From TradingView
Where the current Deriv dashboard does connect to TradingView is through a different route entirely. That is trading Deriv’s own markets directly from TradingView.com’s interface, rather than viewing TradingView’s charts inside Deriv. This is the option genuinely built into the current setup, and it’s worth spending real attention on, since it’s what most users will actually reach for going forward rather than the standalone charting address.

Finding the TradingView Option in the Dashboard
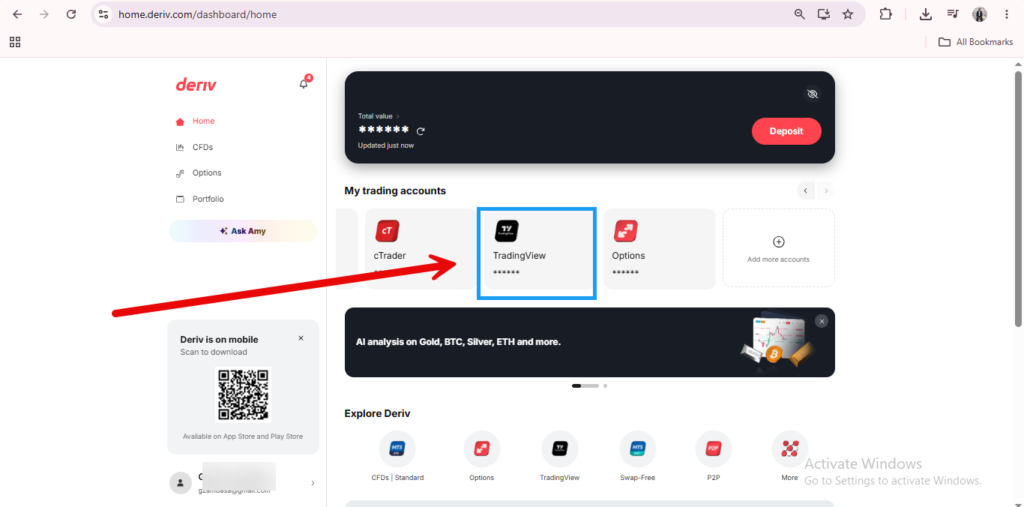
From your dashboard you have multiple ways of accessing TradingView. You can use either the home section or the CFDs section. As seen below you will be able to find TradingView as one of your accounts among MT5, cTrader and others. If you do not seeit simply click “add more” and you will be redirected to a screen where you can add it. You can also find it under “explore Deriv”. Lastly, you can find it in the CFDs section of your dashboard.


Connecting and Trading From TradingView’s Side
Once redirected, you’ll need a free TradingView account if you don’t already have one, then confirm the connection so Deriv appears as a broker within TradingView’s trading panel. From there, you can search for Deriv’s markets, including its exclusive synthetic indices, and place trades directly from TradingView’s own charts with execution still handled by Deriv behind the scenes. Our guide on How to Connect Deriv to TradingView walks through this specific connection process in full detail.
Advanced Charting on charts.deriv.com: What You’re Actually Getting
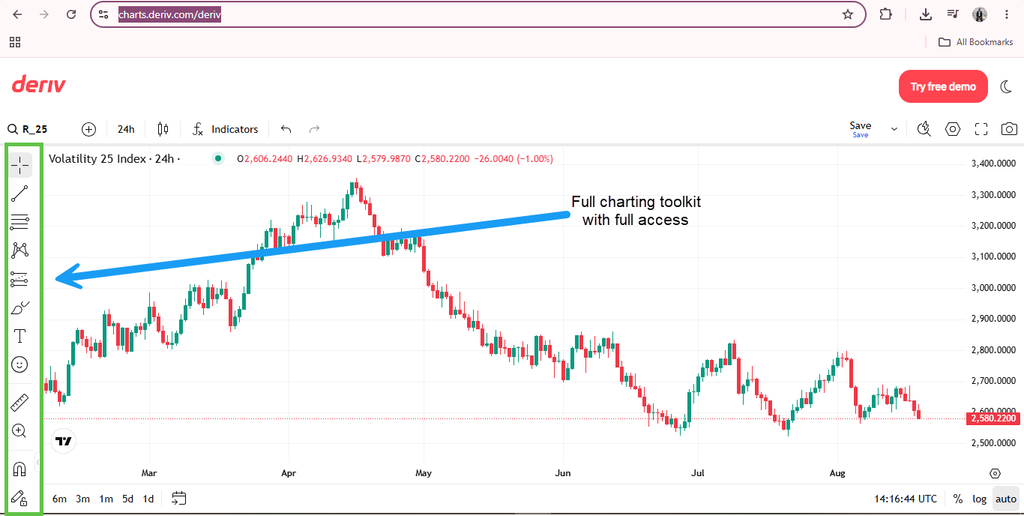
Circling back to the standalone charting address, since it’s still worth understanding even though it’s no longer dashboard-linked: charts.deriv.com gives you the full TradingView charting engine. You have access to over 100 built-in indicators, 110+ drawing tools, and multiple chart types applied to Deriv’s markets, including its synthetic indices. It’s a genuinely capable environment for research and analysis, and logging in there uses the same Deriv credentials you already have, so there’s no separate account to manage on that front. The trade-off is simply that it now sits outside the main dashboard flow, so you’ll want to bookmark the address if you use it regularly rather than expecting to stumble onto it while browsing your Dashboard.

Getting comfortable with tools like this is one part of using Deriv well, but there’s also a completely separate way to benefit from the platform that skips charting entirely. It’s explained here, worth a look regardless of how deep you get into technical analysis.