If you’ve spent any time around trading communities, you’ve probably heard TradingView mentioned constantly. It’s one of the most widely used charting platforms in the world, and TradingView’s own site gives a sense of just how central it’s become to how people analyze markets, with millions of users sharing charts, ideas, and analysis across nearly every asset class imaginable. Deriv has built a genuine integration with it, and understanding what that actually means is worth a few minutes before you go looking for it on your dashboard. In short, TradingView is a charting and technical analysis platform, and Deriv has connected it in two distinct ways: by embedding TradingView’s charts directly into platforms like Deriv X(now discontinued), and, more recently, by letting you connect a Deriv account to TradingView itself to trade Deriv’s own markets from there.
Make sure you already have a Deriv account or quickly create one here before going through the rest of the article.
TradingView as a Charting Tool
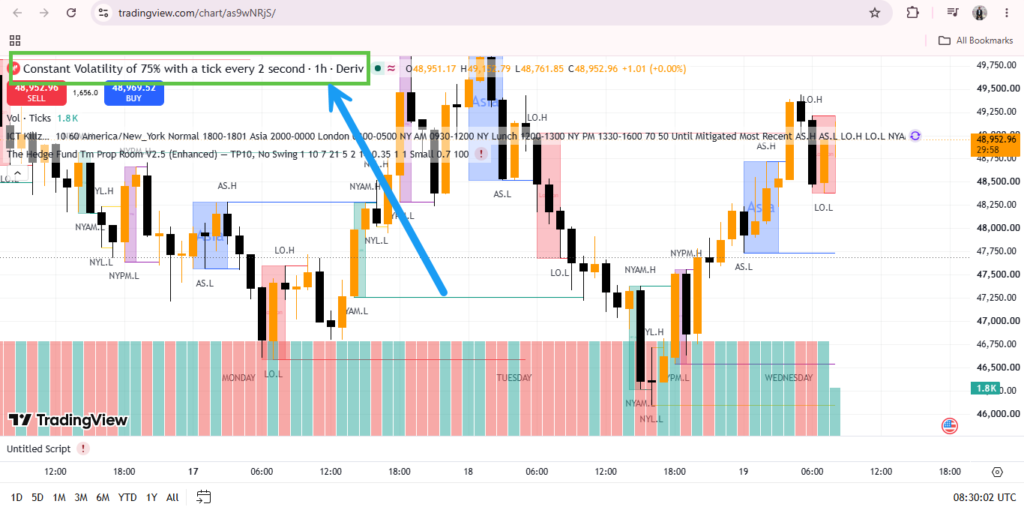
At its core, TradingView is known for deep technical analysis. It has over 100 built-in indicators, more than 110 drawing tools, and a wide range of customizable chart types, far beyond what a typical broker’s native charts offer. Traders use it to spot trends, mark support and resistance levels, apply Fibonacci retracements, and layer multiple indicators onto a single chart without the interface becoming unusable. It’s also built around a large community, with millions of users publishing their own chart ideas and analysis publicly, which is part of why it’s become something of an industry standard rather than just another charting tool among many.


How It’s Built Into Deriv
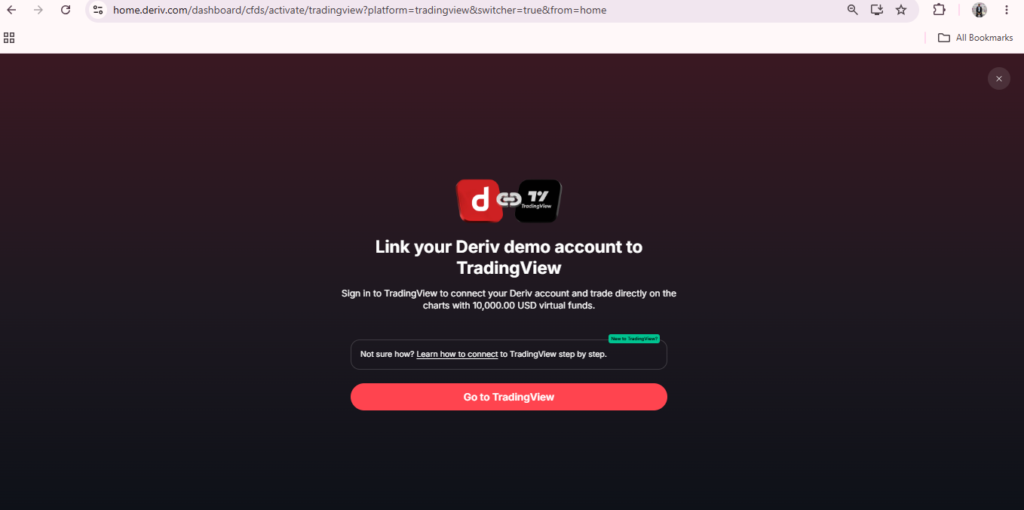
TradingView used to be built into Deriv X a discontinued platform. Now you can access TradingView from your Deriv dashboard and get redirected to TradingView. From there you follow prompts to connect the two accounts. You get full access to the Deriv markets from inside TradingView essentially giving you TradingView’s advanced tools and charting for your Deriv account.
The Newer Integration: Trading From TradingView Itself
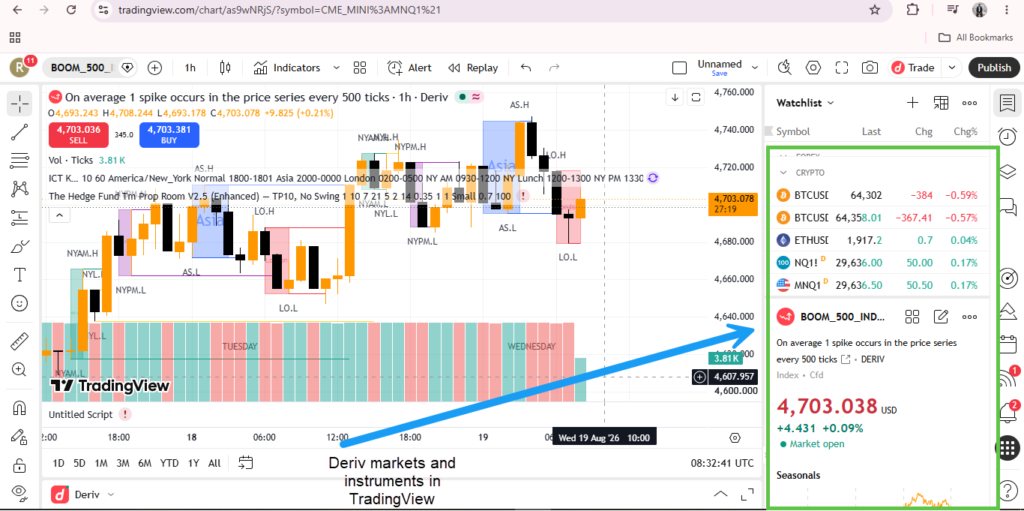
Linking your Deriv account to TradingView.com directly, lets you analyze and trade Deriv’s own synthetic markets. These include Volatility and Boom/Crash Indices all within TradingView’s own interface rather than Deriv’s. This is a meaningfully different setup from the embedded version in Deriv X: instead of TradingView living inside Deriv, your Deriv account effectively becomes a connected broker within TradingView, appearing alongside whatever other brokers you might already use there. For traders who already spend most of their day inside TradingView analyzing multiple markets across different brokers, this means Deriv’s exclusive synthetic indices become just another instrument available from the same familiar screen, rather than something requiring a separate platform entirely.

Why This Matters for Deriv Users
Combining TradingView’s analysis depth with Deriv’s own execution and markets means you’re not choosing between a great charting tool and access to Deriv’s specific instruments but you get both together. Our guide on How to Access TradingView From the Deriv Dashboard covers the embedded version step by step, and How to Connect Deriv to TradingView walks through linking your account directly on TradingView.com.
What’s Coming Up in This Series
The rest of this series covers connecting the two platforms, where to find TradingView within Deriv, whether it costs anything extra, and how the two compare as tools in their own right and worth working through in order if you’re still deciding which integration path actually suits how you trade.
Understanding tools like this is one part of building confidence on Deriv but there’s a completely different track worth knowing about too, built around earning by referring others rather than analyzing charts yourself. It’s worth a look here if that’s new to you.